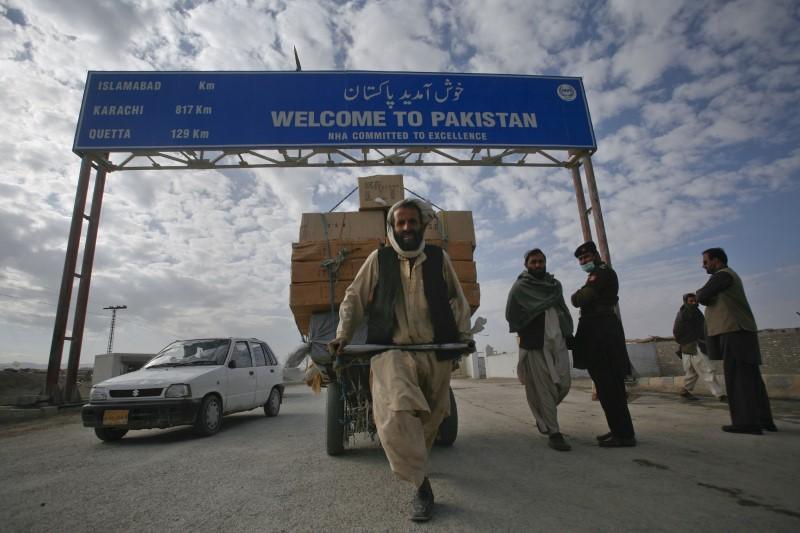
Economic Comparison: Pakistan vs. Afghanistan
Key Indicators, Financial Systems, Debt, Reserves, and Economic Structure (2025)
Key Economic Indicators
- GDP (Nominal): Pakistan’s GDP is $314.6 billion, ranking 41st globally, while Afghanistan’s is $19.4 billion, ranking 116th [4].
- GDP Growth Rate: Pakistan’s 1-year growth rate is 5.2% and 5-year average is 4.7%, compared to Afghanistan’s 2.3% (1-year) and 2.2% (5-year average) [6], [7].
- GDP Per Capita: Pakistan’s GDP per capita is $1,500, significantly higher than Afghanistan’s $521 [4].
- GDP Per Capita Growth: Pakistan’s GDP per capita growth is 3.68%, while Afghanistan’s is -1.35%, reflecting economic contraction [0].
Financial System and Human Development
- Income Tax Rate: Pakistan’s income tax rate is 30%, compared to Afghanistan’s 20% [0].
- Corporate Tax Rate: Pakistan levies a 30% corporate tax rate, while Afghanistan’s is 20% [0].
- Inflation Rate: Pakistan’s inflation rate is 3.9%, higher than Afghanistan’s 0.6%, which benefits from stable exchange rates and UN aid [6], [7].
- Unemployment Rate: Afghanistan’s unemployment rate is 1.5%, lower than Pakistan’s 3%, though underreporting and informal labor markets may skew these figures [0].
Government Debt and Reserves
- Central Government Debt: Pakistan’s debt is 72.1% of GDP, significantly higher than Afghanistan’s 7.1%, reflecting Pakistan’s heavier reliance on borrowing [0].
- External Debt Stocks: Pakistan’s external debt is $91 billion, compared to Afghanistan’s $2.6 billion, constrained by sanctions and frozen assets [0], [1].
- Total Reserves: Pakistan holds $11.8 billion in reserves (including gold), compared to Afghanistan’s $8.2 billion, despite frozen central bank assets [0].
Economic Structure
- Exports: Pakistan’s exports contribute 8.8% to GDP ($31 billion in 2024, mainly textiles and agriculture), while Afghanistan’s contribute 5.9% ($2 billion, mostly agricultural and mineral products) [6], [0].
- Imports: Afghanistan’s imports account for 45.3% of GDP ($7 billion in 2022), far exceeding Pakistan’s 19.7% ($53.2 billion in 2024), reflecting Afghanistan’s trade dependency [6], [0].
- Industry Value Added: Industry contributes 18% to Pakistan’s GDP (manufacturing, textiles), compared to 22.1% in Afghanistan (small-scale production, mining) [0], [1].
Conclusion
Pakistan’s economy significantly outpaces Afghanistan’s in scale, with a GDP 16 times larger and stronger growth rates, driven by a diverse industrial base and global trade integration. However, Pakistan faces challenges with high debt (72.1% of GDP) and inflation (3.9%). Afghanistan’s smaller economy, heavily reliant on agriculture and imports, benefits from lower inflation (0.6%) and debt (7.1%), but is constrained by political instability and frozen assets. Both nations face structural hurdles—Pakistan with fiscal deficits and Afghanistan with aid dependency—but Pakistan’s larger market and resources give it a stronger economic position, while Afghanistan’s recovery shows resilience [4], [8], [12].